
Crowd Density Monitoring
Live crowd counts, zone density and congestion alerts from existing CCTV, giving operations teams a clear view of where people are gathering
- Transport hubs / Retail / Venues
- AI
- Computer vision
- Python
- YOLO
- OpenCV
- Edge computing
The project
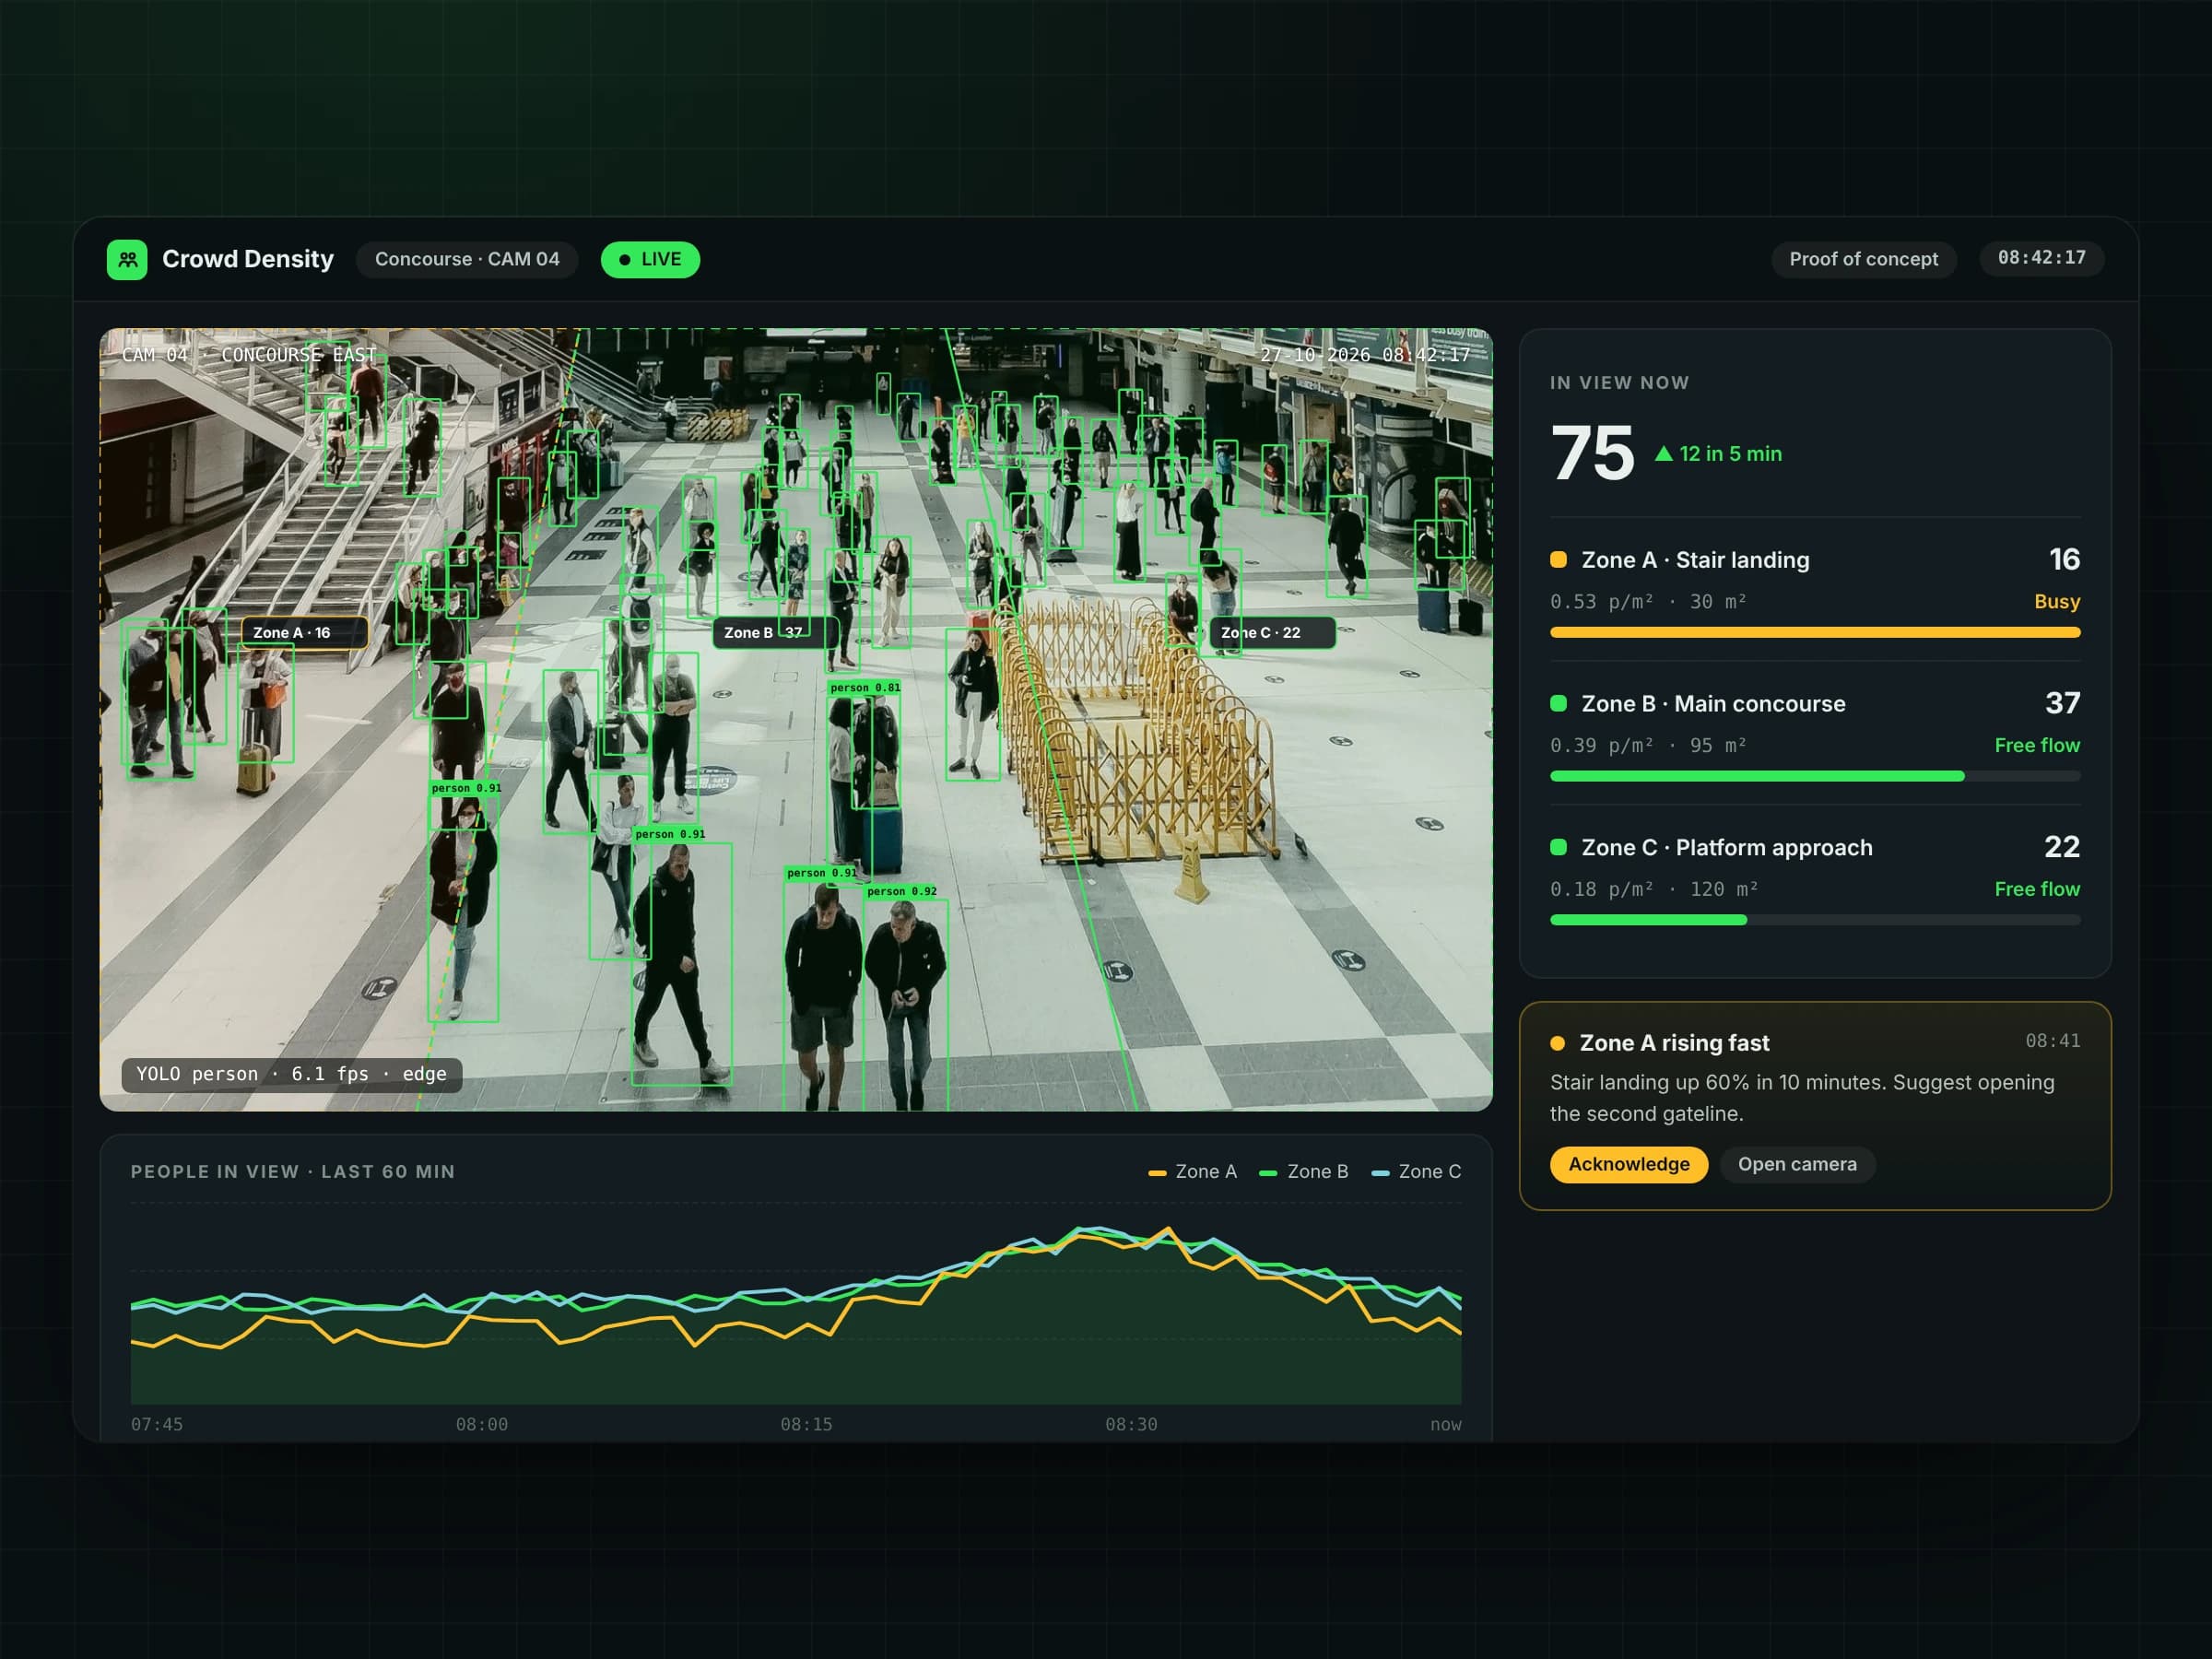
We built a crowd monitoring system that turns existing CCTV feeds into live people counts and density readings for individual zones. Operations teams can see which areas are filling up, review where people spend time, and respond to congestion from one dashboard.
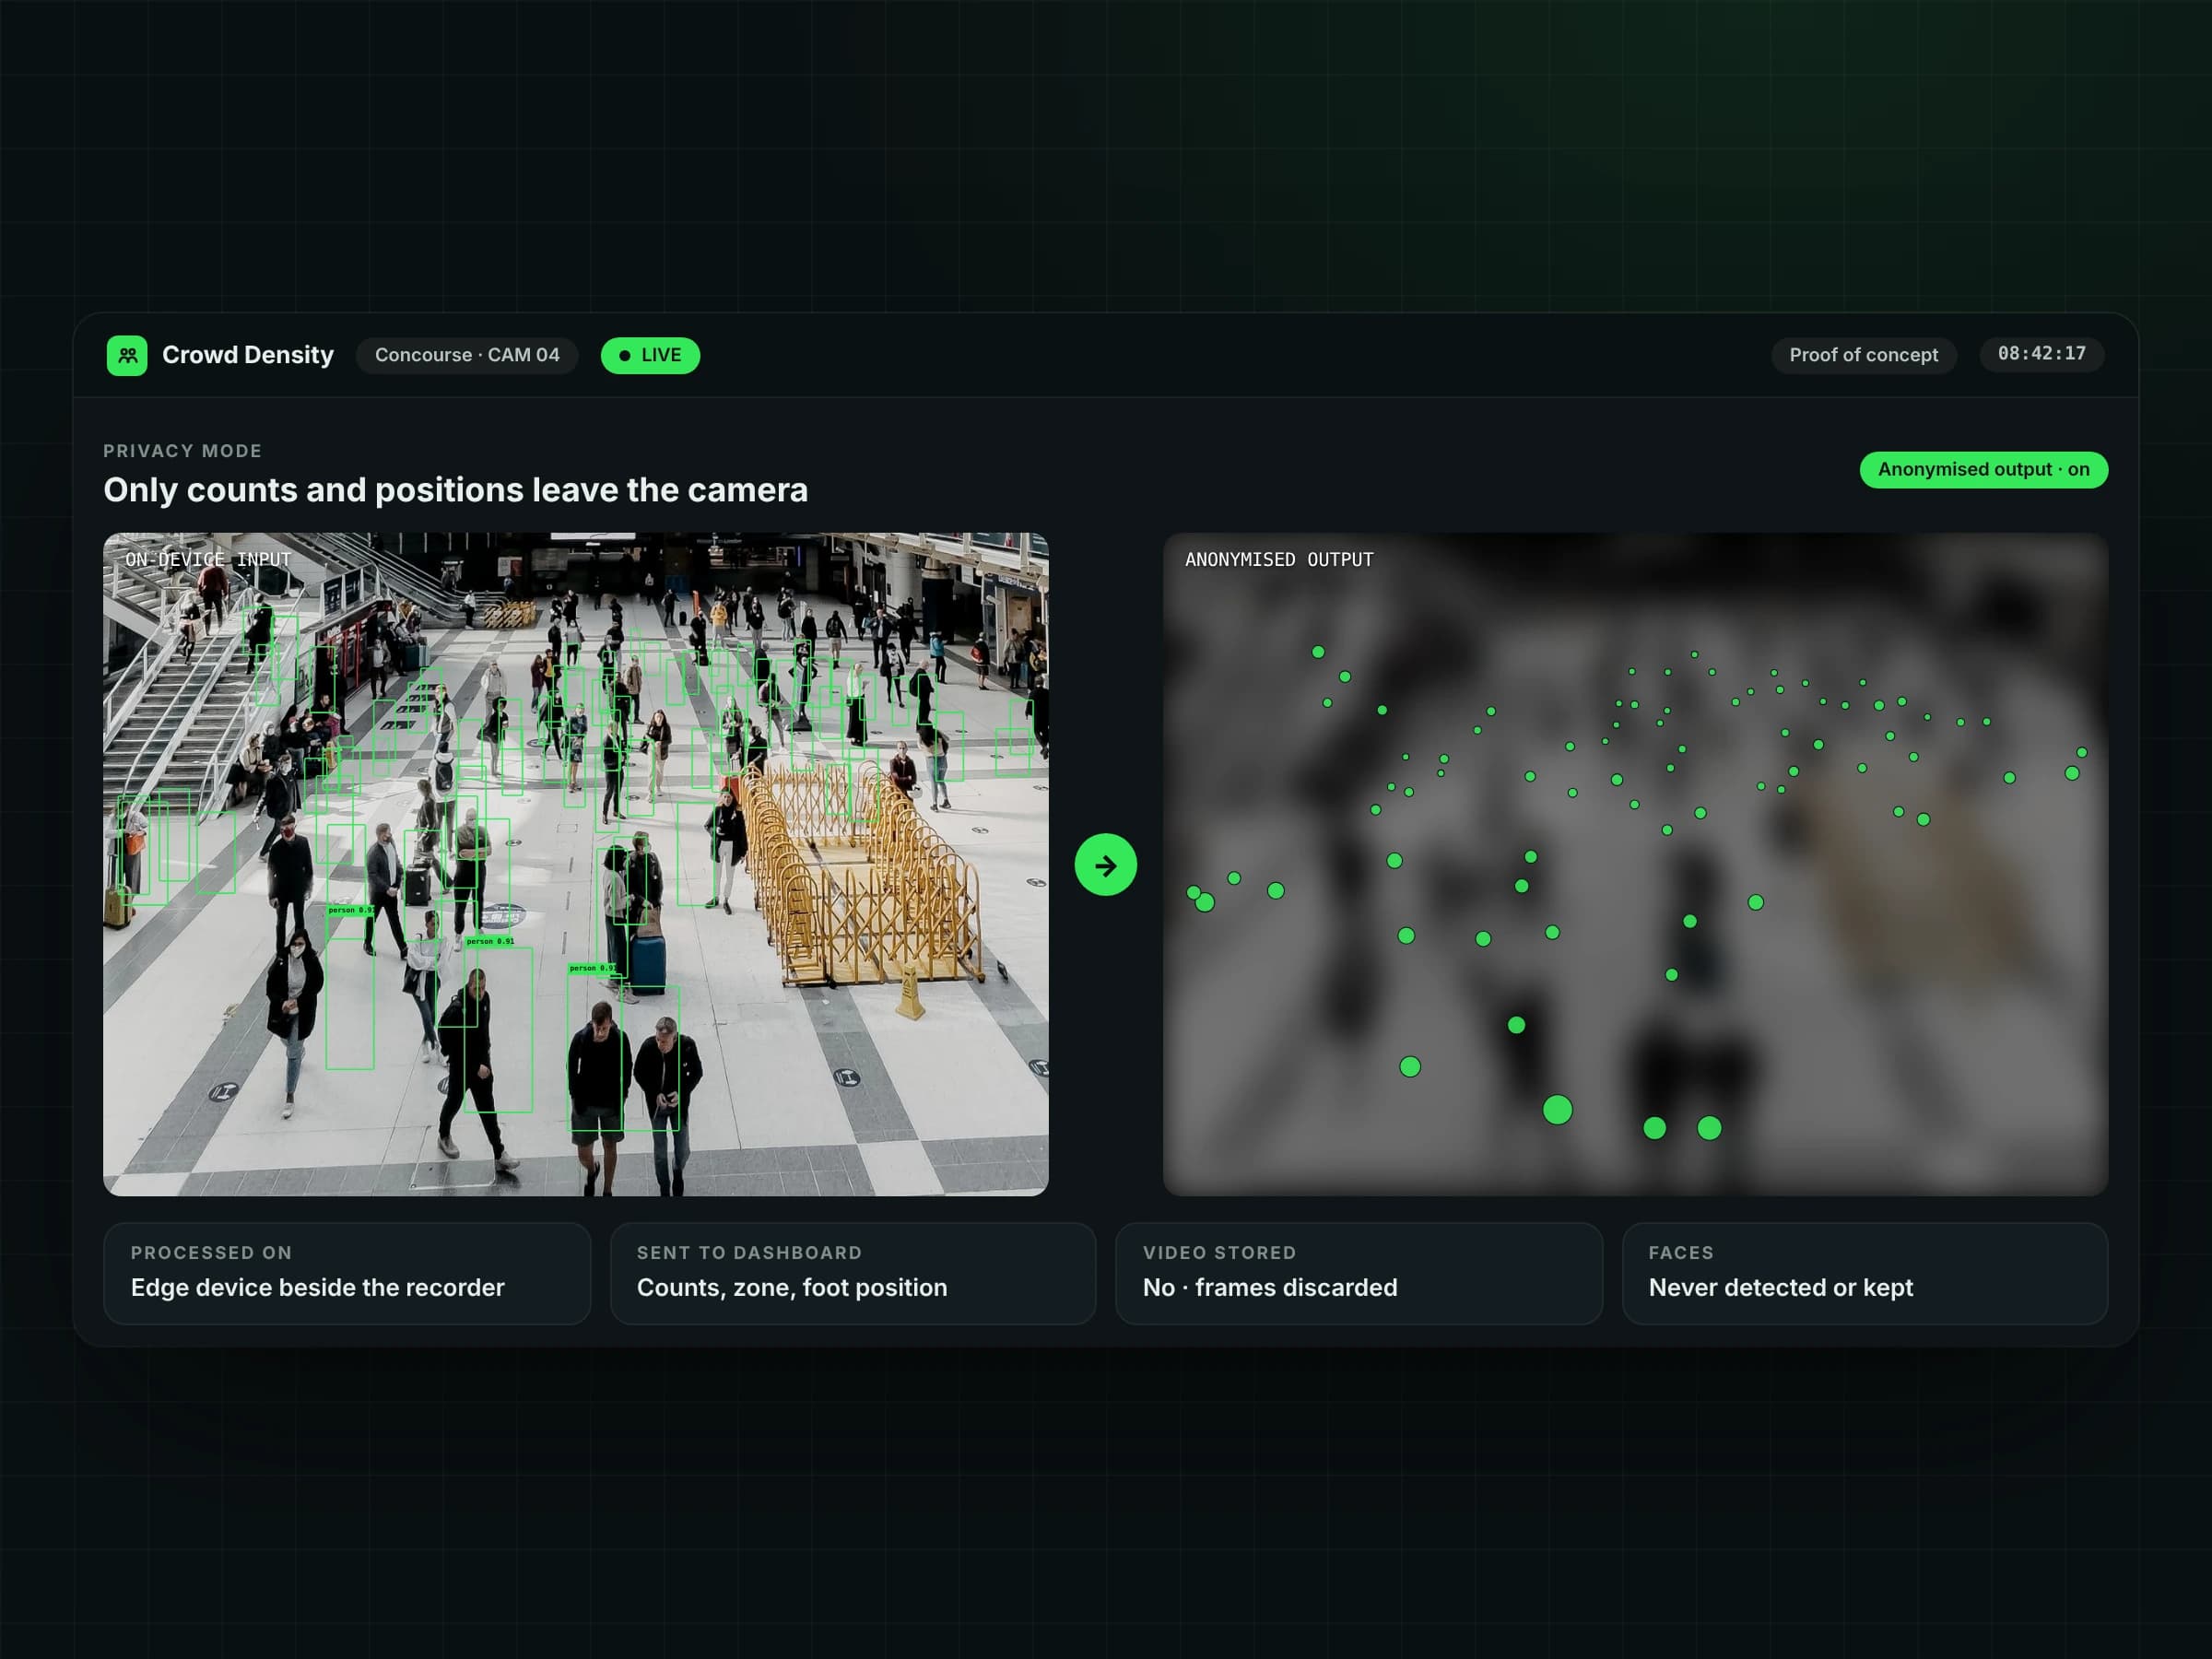
The system combines person detection, mapped floor areas, configurable alerts and daily reporting. Processing runs on an edge device beside the recorder, with counts and positions sent to the dashboard rather than stored video.
The challenge
A camera wall shows what is happening, but someone still has to watch it. In a busy concourse, shopping centre or venue, staff can miss a queue spreading into a walkway or a landing filling up while their attention is elsewhere.
Door counters offer a total for the building, but they do not show where people are standing. The challenge was to turn those existing camera views into a practical picture of crowding: by location, over time, and at the point when staff need to act.
The solution
We built a computer vision pipeline that detects people in each camera view and assigns them to operator-defined zones using their position on the floor. Each zone is mapped to a floor area, allowing the system to show both a count and an estimate of people per square metre.
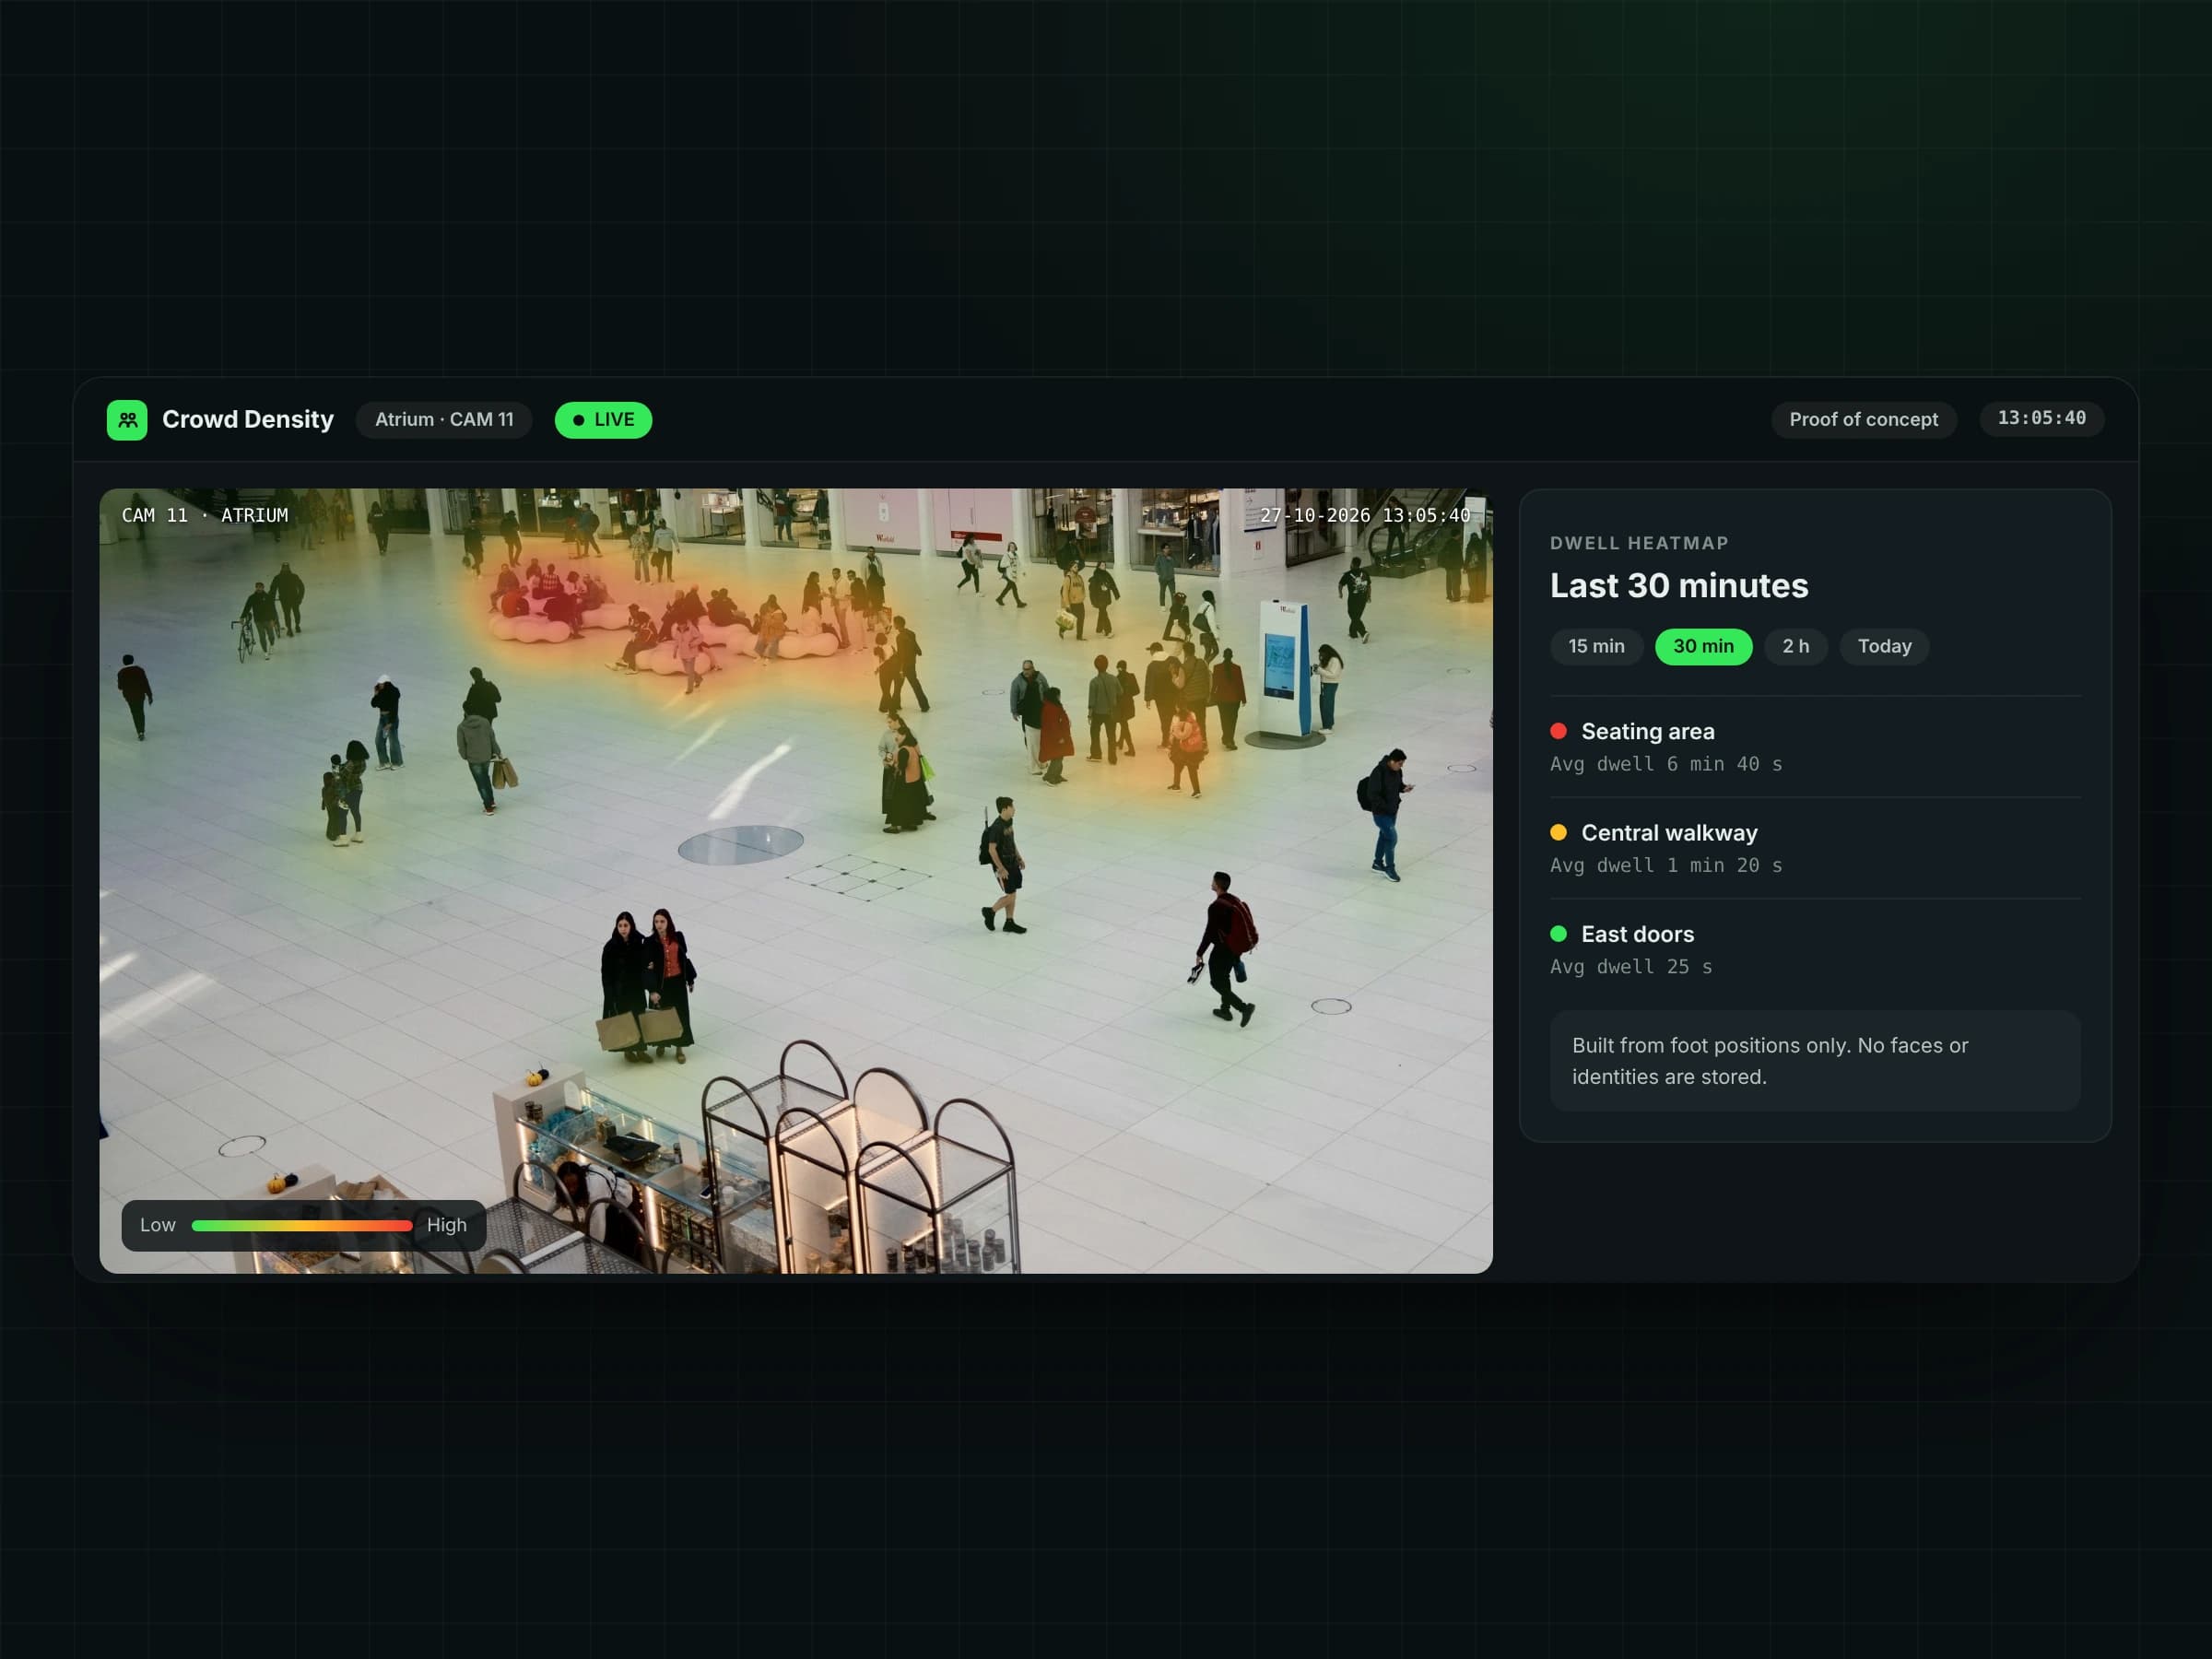
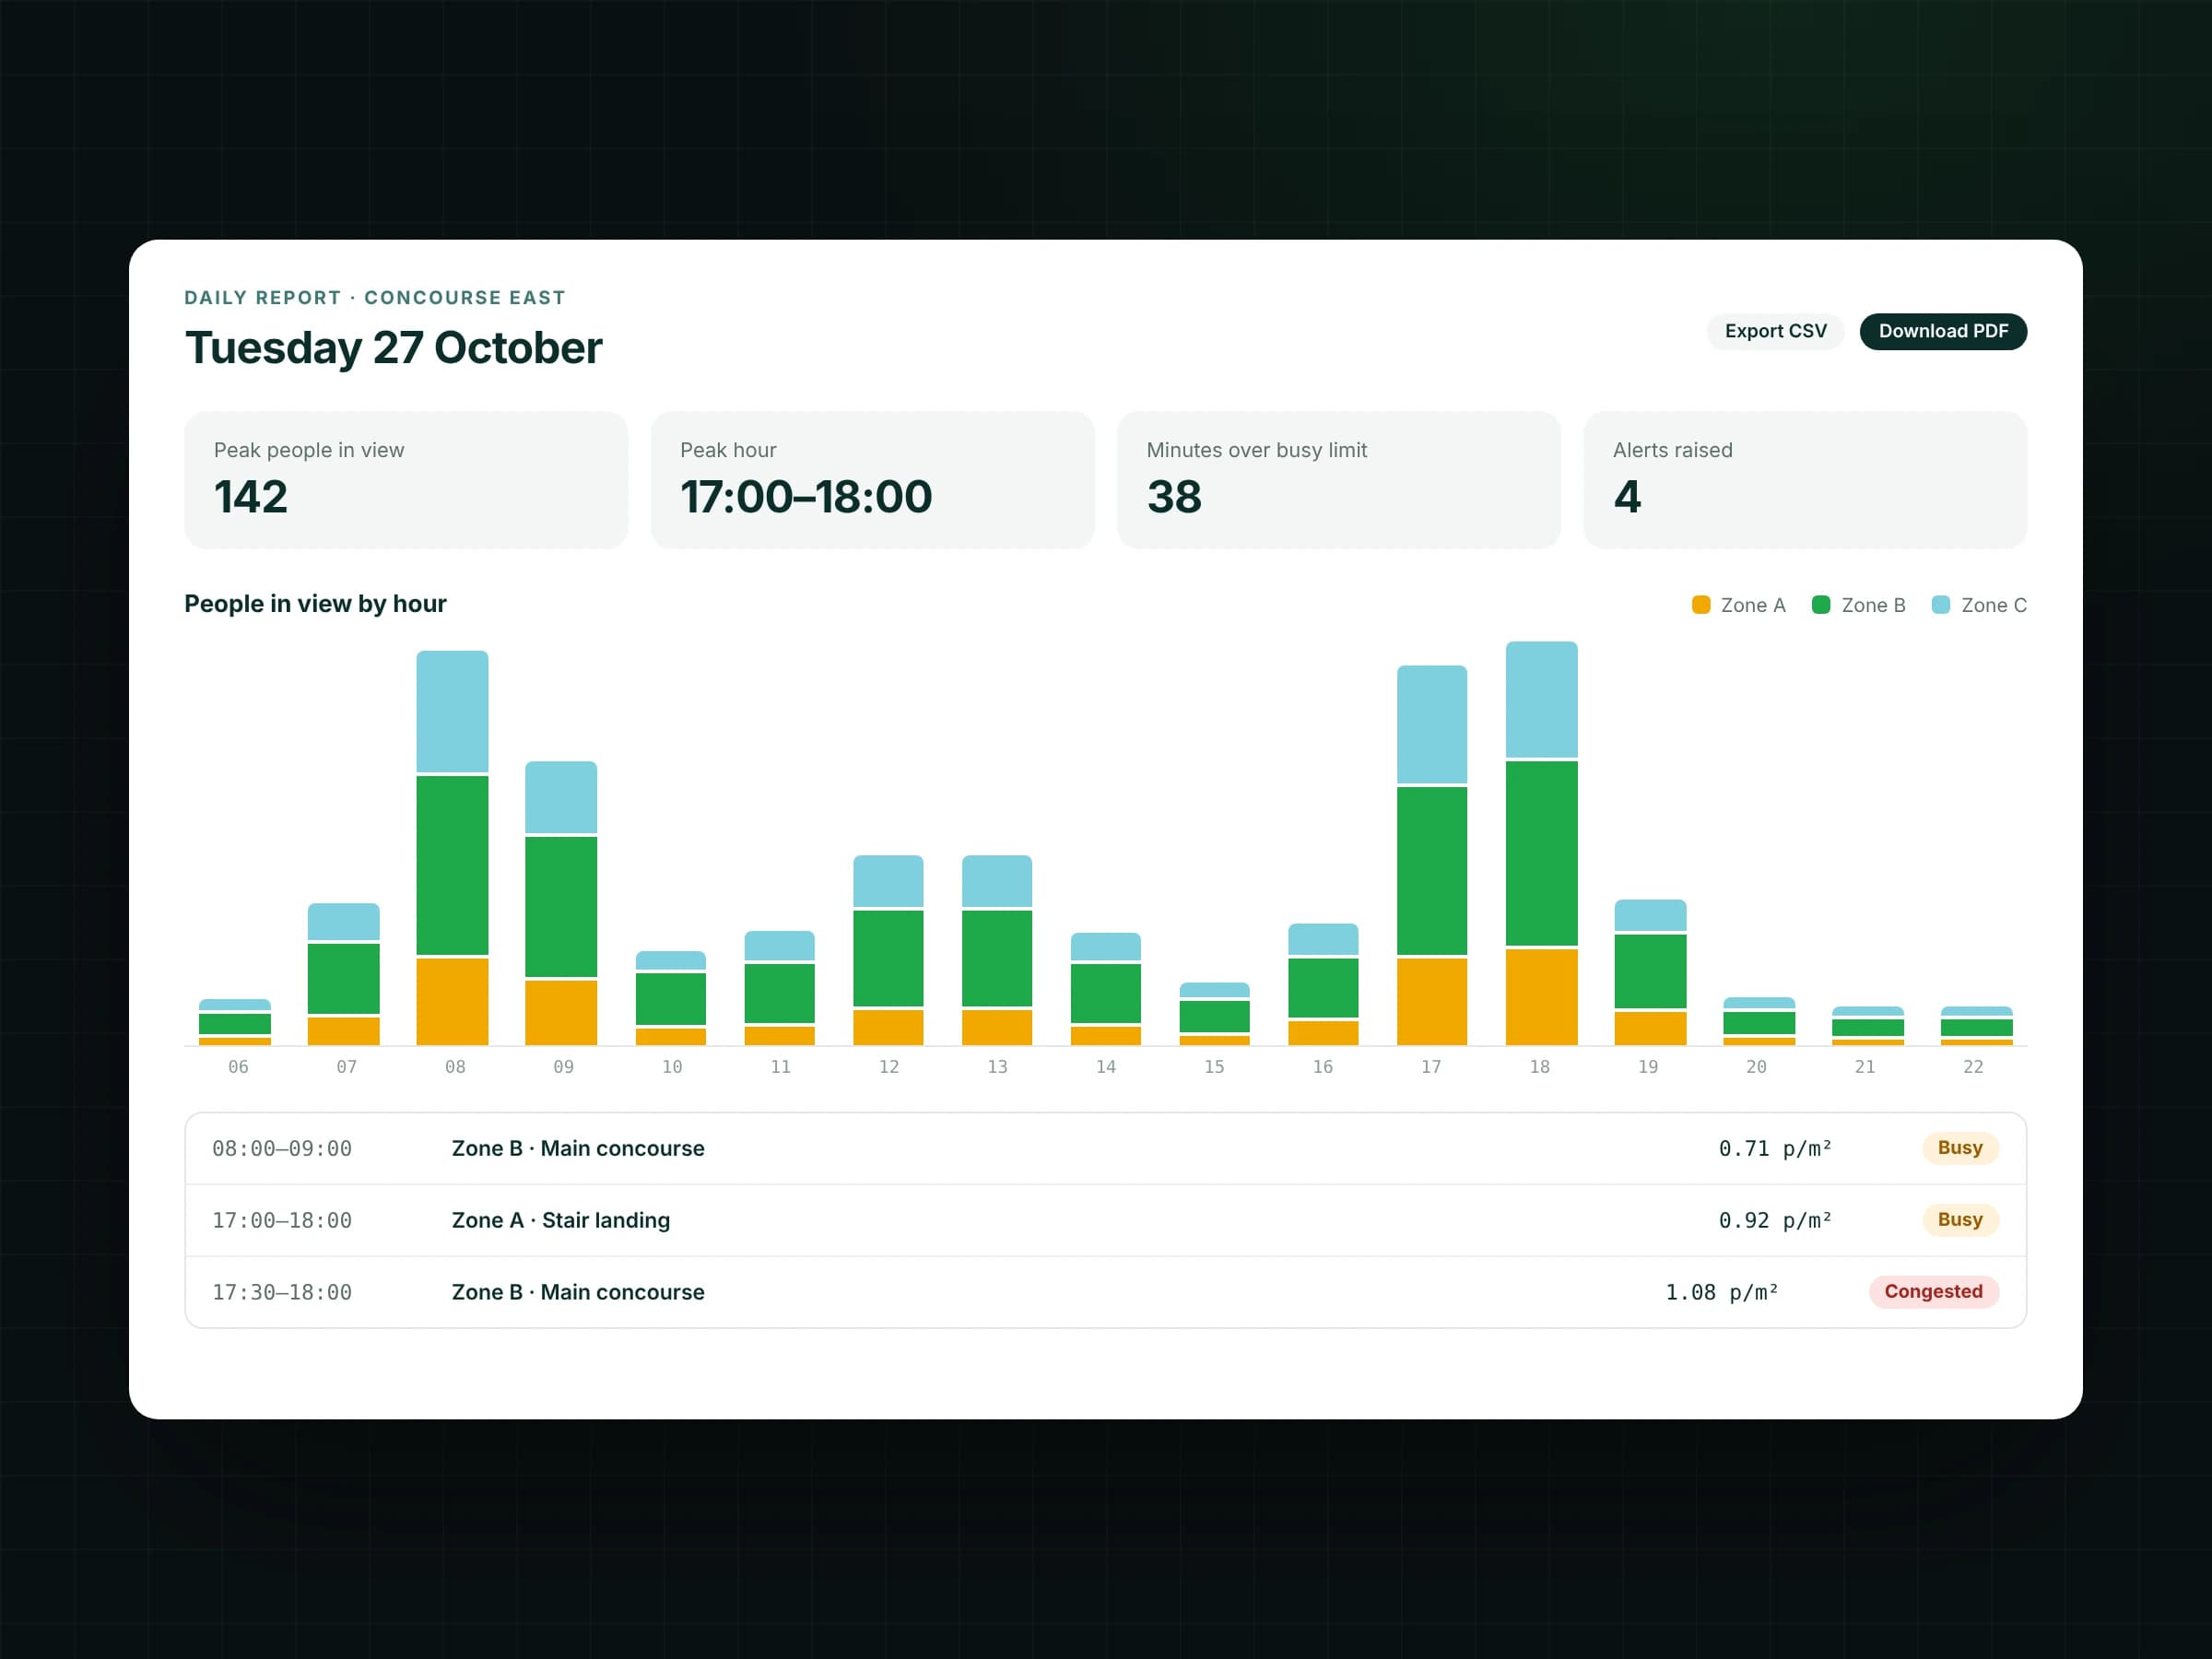
The dashboard brings together live zone counts, recent trends and busy or congested thresholds set by the operator. Alerts flag zones that fill quickly, while dwell heatmaps show where people gather and daily reports reveal the busiest hours. Staff can use the live view to respond and the historical view to plan staffing and flow through the space.
Processing runs at the edge beside the camera recorder. Frames are discarded after analysis, and the dashboard receives counts and positions without identifying the people in the scene. The result is a continuous operational view built around the cameras already installed.
What it does
- Person detection on existing CCTV
- Zones drawn per camera view
- People per square metre for each zone
- Busy and congested levels set by the operator
- Alerts when a zone fills quickly
- Dwell heatmap of where people gather
- Hourly and daily reports
- Edge processing next to the recorder
- Counts and positions only: no faces, no stored video
How we built it
- Map the space: Defined the areas to monitor, their floor areas, crowding thresholds and the staff response for each alert.
- Build the detection pipeline: Developed person detection and zone assignment, checking counts across different camera views and levels of crowding.
- Create the operations view: Built the live dashboard with zone counts, density readings, trends, dwell heatmaps and configurable alerts.
- Connect reporting: Combined edge processing with hourly and daily reporting so teams can review patterns as well as current conditions.
The results
- None Video stored
- 0 New cameras needed
- Any Zones per camera
Backendz & Crowd Density Monitoring: Highlights

Still running on workarounds?
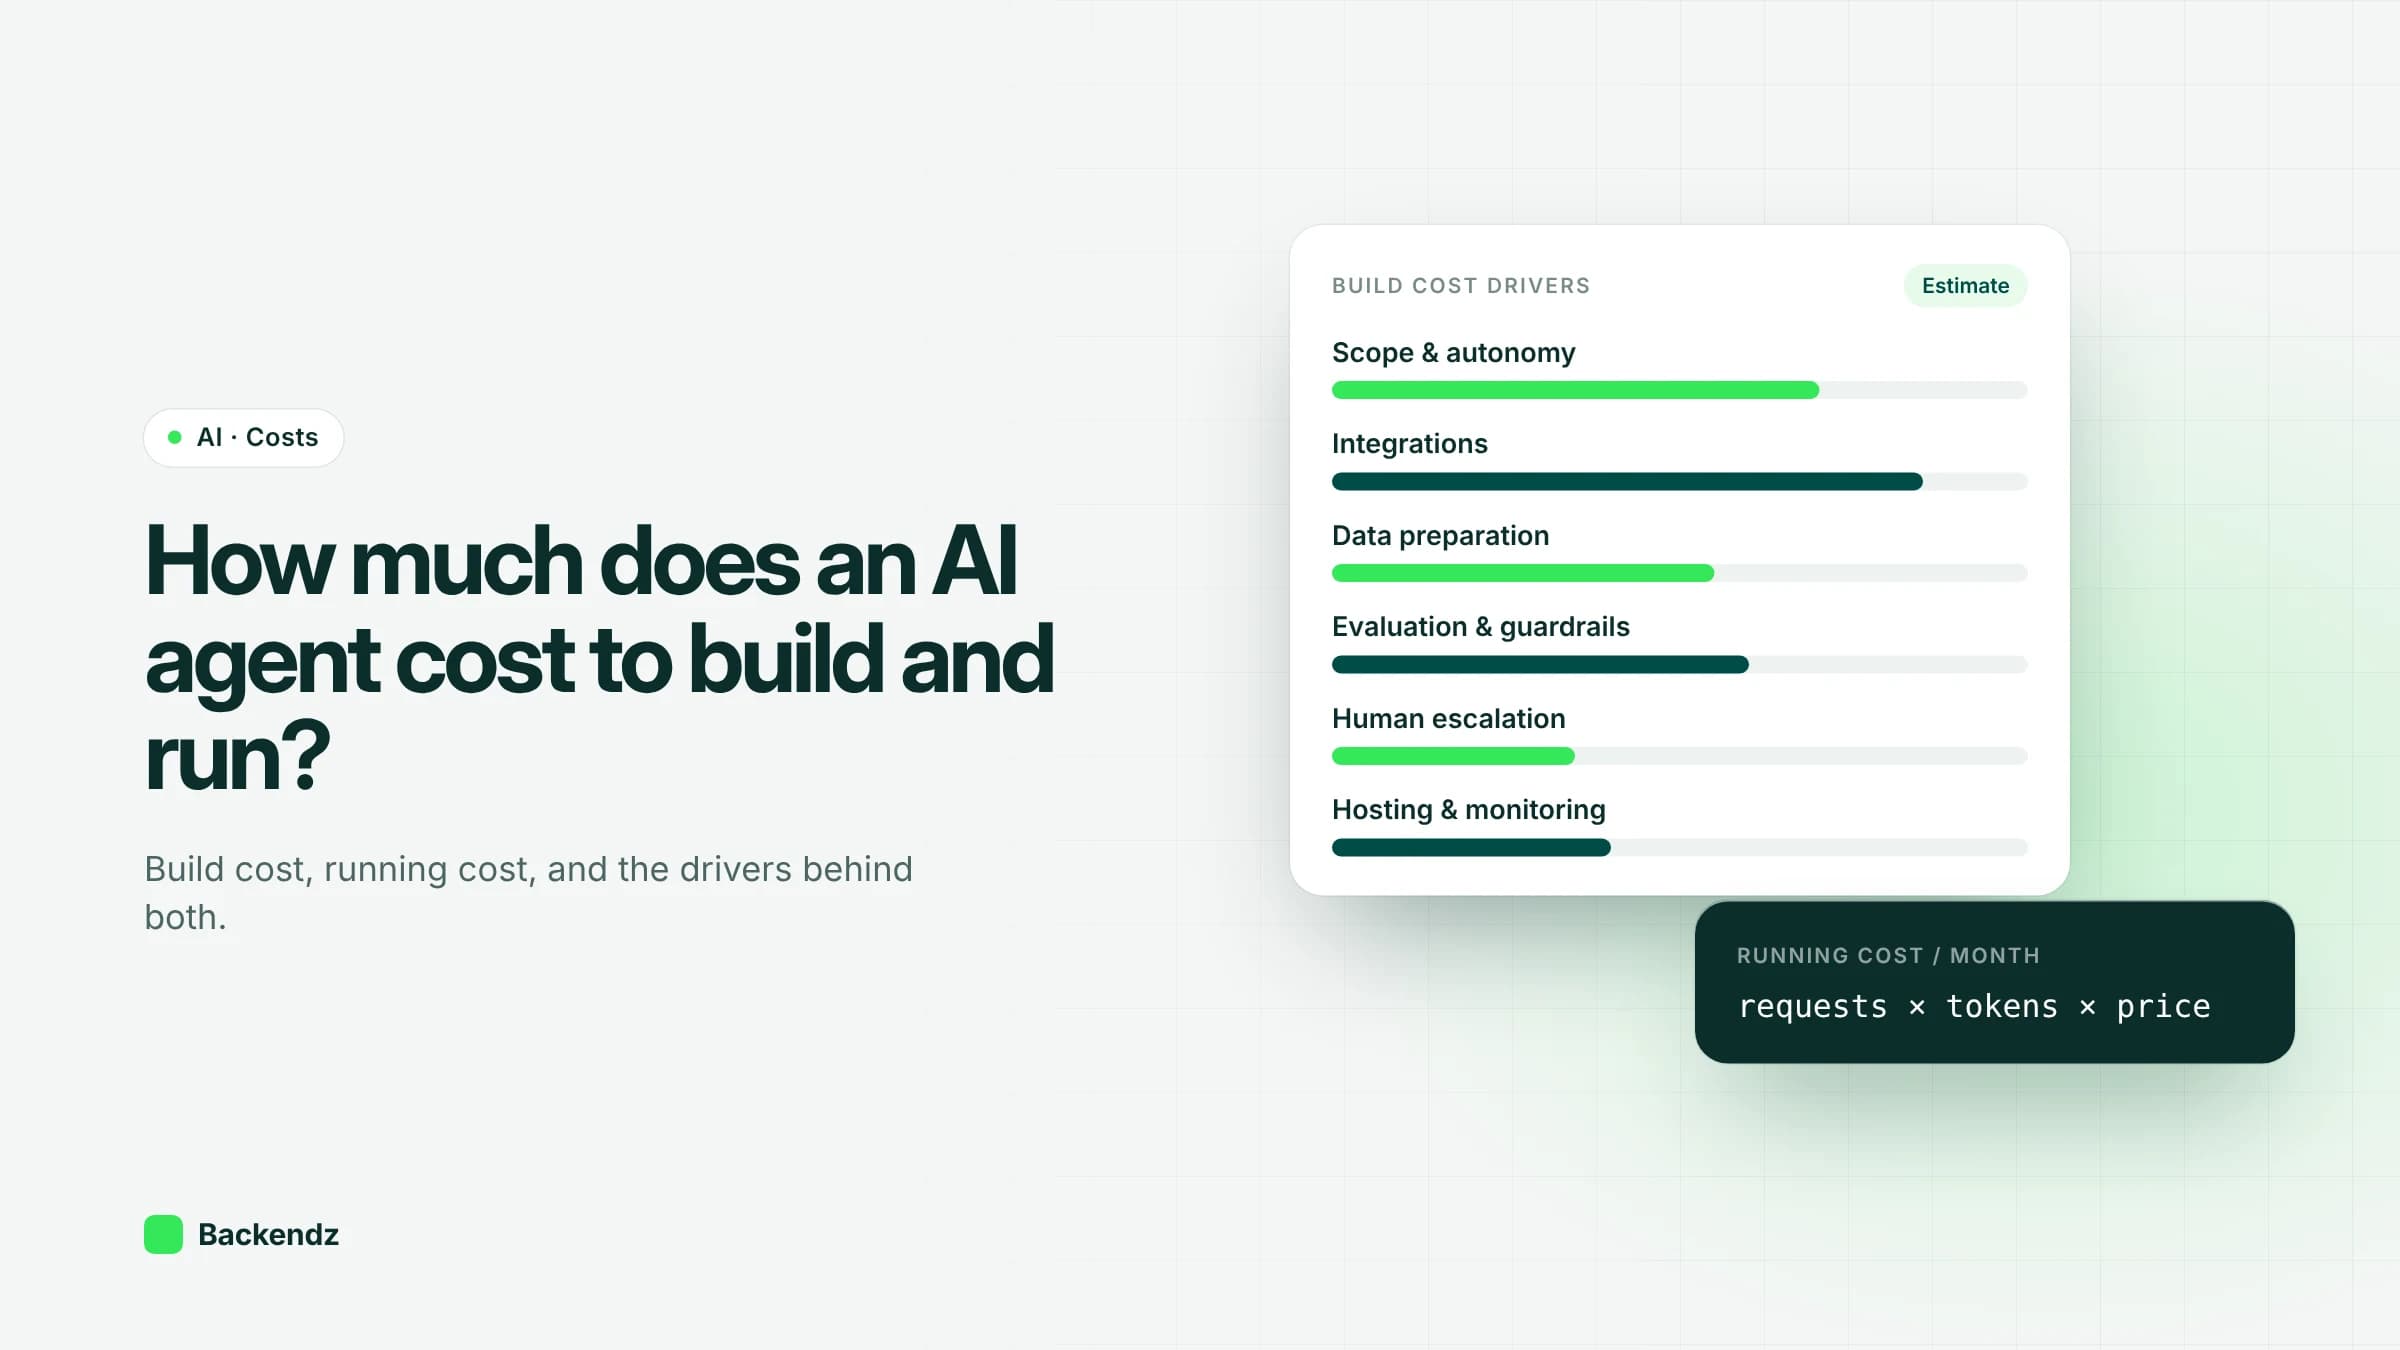 AIHow much does an AI agent cost to build and run in the UK?Read article
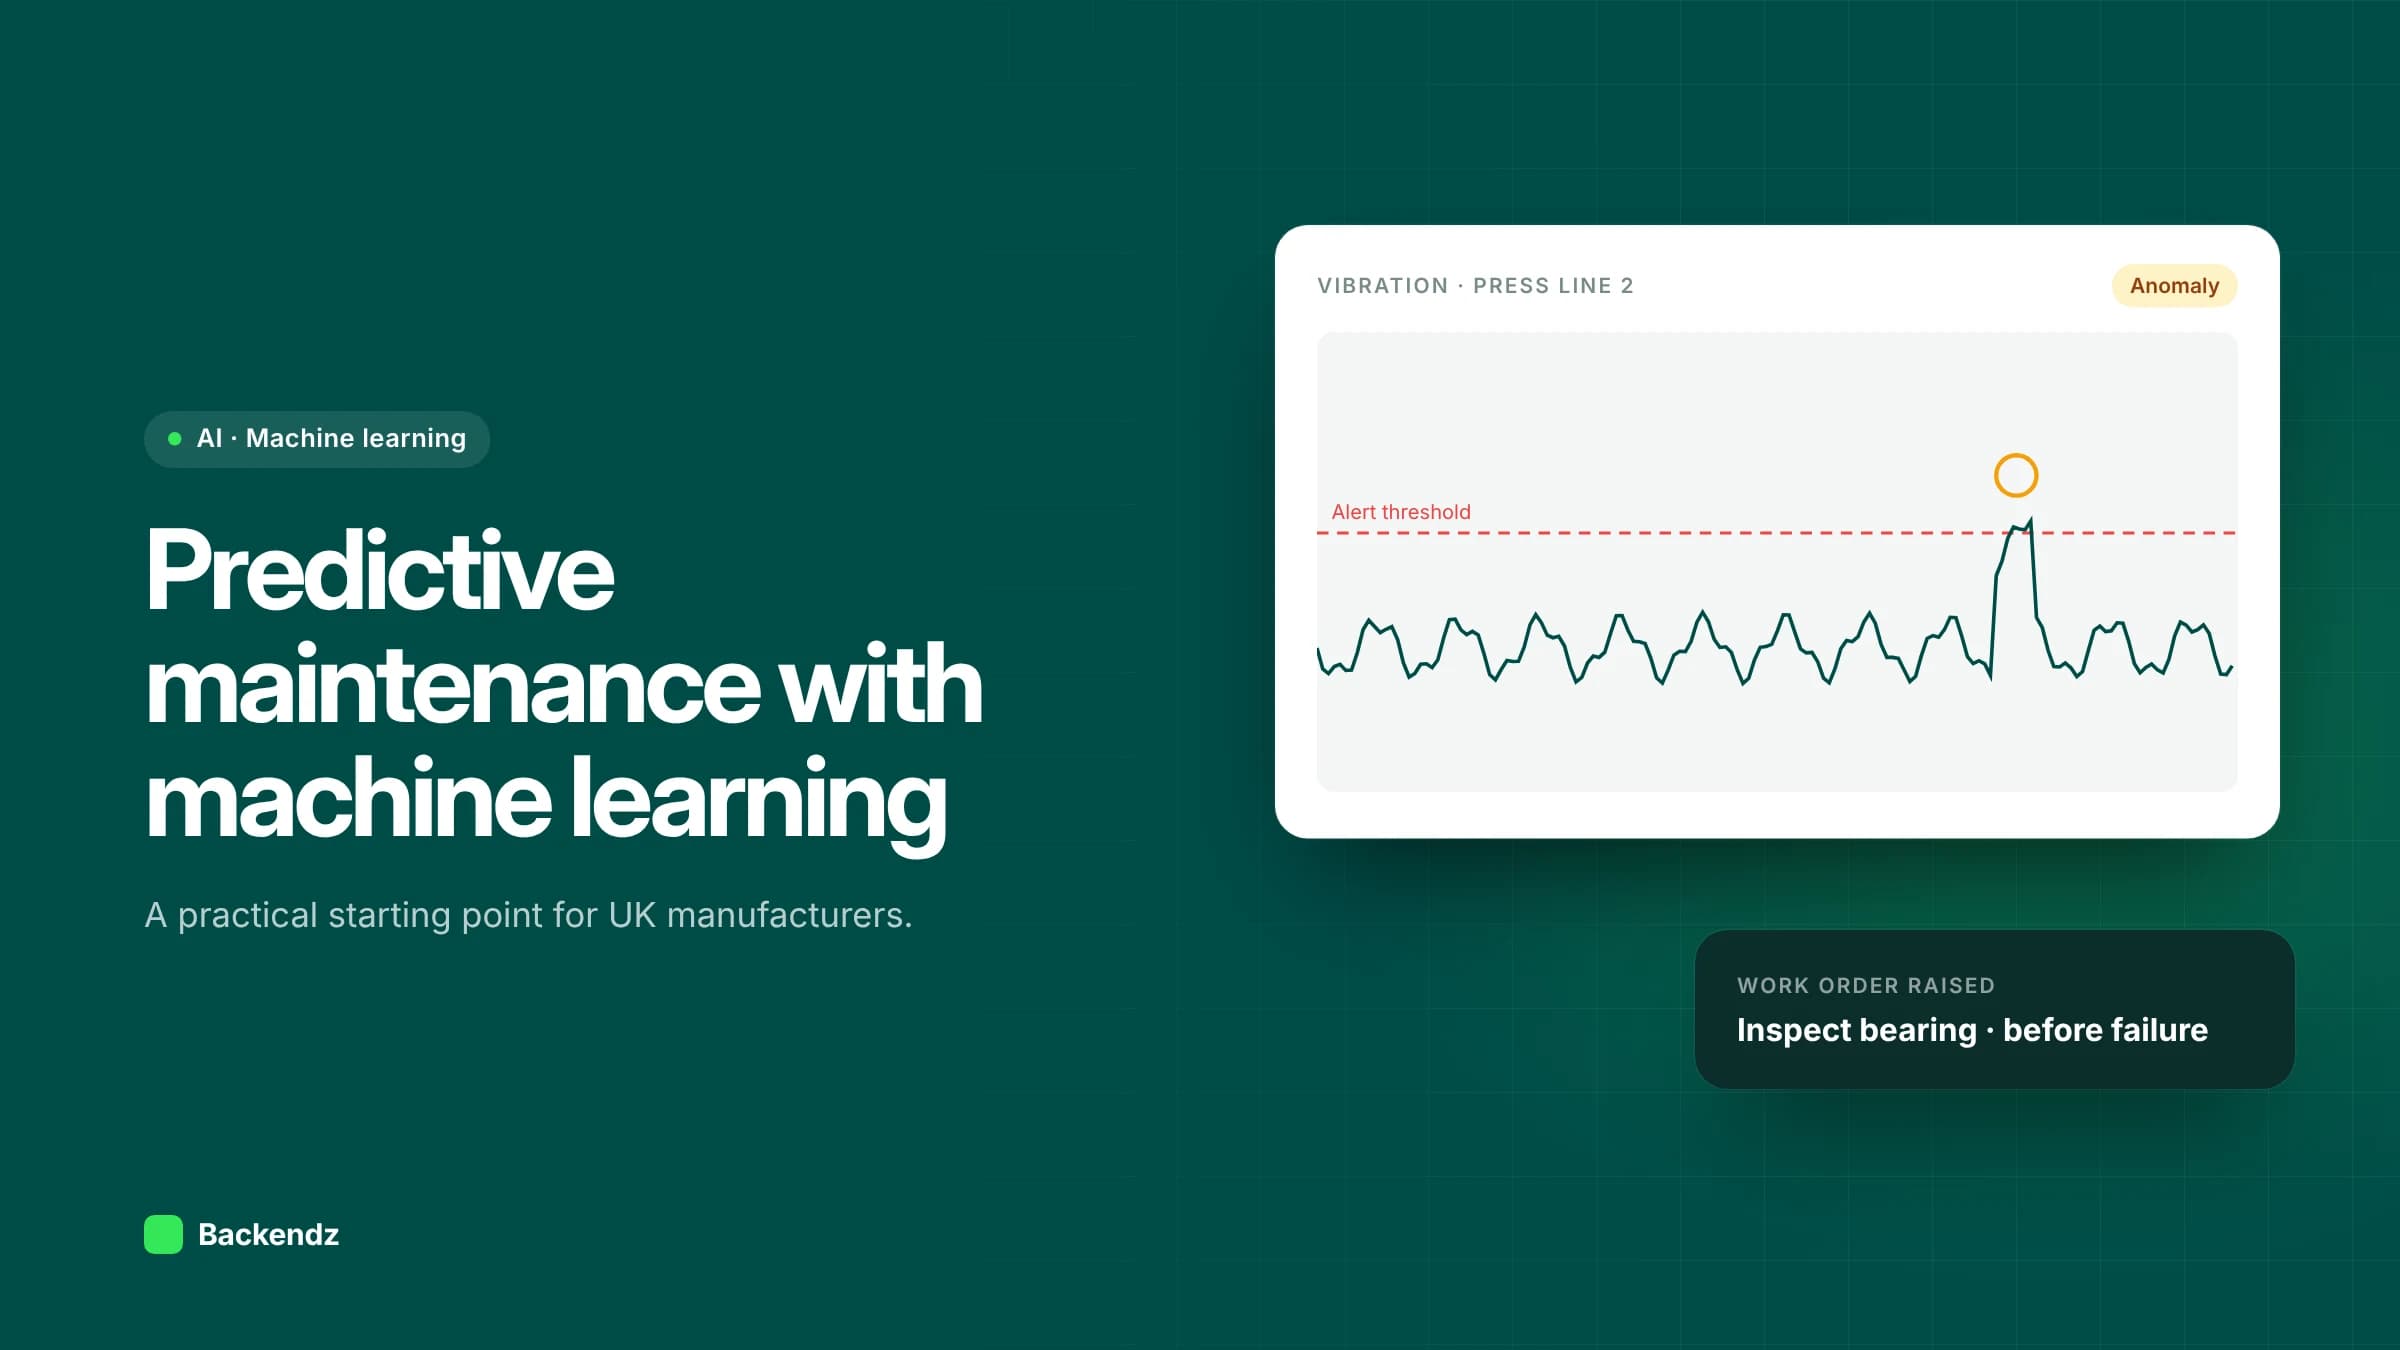 AIPredictive maintenance with machine learning for UK manufacturersRead article
 AIWhere to start with AI workflow automation in operationsRead article
 EngineeringCustom CRM or off-the-shelf? When building your own makes senseRead article